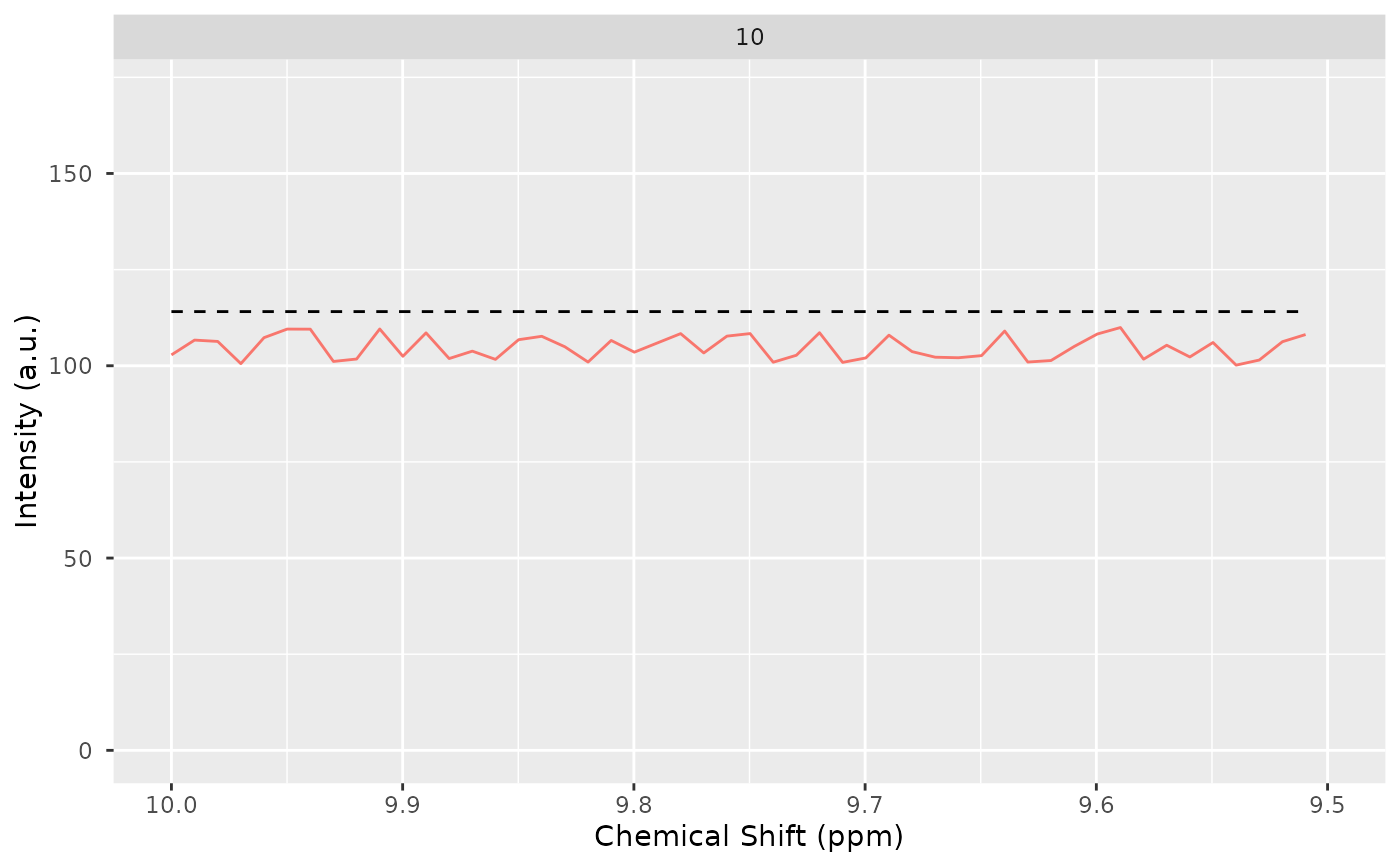
With many samples, a single page can't legibly show one facet per sample;
nrow/ncol/page paginate the facets instead of cramming (or silently
subsampling) them all onto one page.
Usage
nmr_baseline_threshold_plot(
  nmr_dataset,
  thresholds,
  NMRExperiment = NULL,
  chemshift_range = NULL,
  nrow = NULL,
  ncol = NULL,
  page = 1,
  ...
)
Arguments
- nmr_dataset
An nmr_dataset_1D object
- thresholds
A named vector. The values are baseline thresholds. The names are NMRExperiments.
- NMRExperiment
The NMRExperiments to plot.
NULL(the default) plots every sample (paginated vianrow/ncol/page);"all"is a synonym forNULL; or pass a character vector to filter to a specific subset of samples.- chemshift_range
The range to plot, as a first check use the
range_without_peaksfrom nmr_baseline_threshold- nrow, ncol
Number of rows/columns of facets per page.
NULL(the default) picks a snug grid for the number of samples requested: 1xnfor fewer than 4 samples, 2x2 for 4, 2x3 for 5-6, and a fixed 3x3 (paginated viapage) for 7 or more.- page
Which page of facets to plot (1-indexed). Requesting a page beyond the number available is an error.
- ...
arguments passed to ggplot2::aes (or to ggplot2::aes_string, being deprecated).
Examples
ppm_axis <- seq(from = 0, to = 10, length.out = 1000)
data_1r <- matrix(runif(1000, 0, 10), nrow = 1) + 100
dataset_1D <- new_nmr_dataset_1D(
    ppm_axis = ppm_axis,
    data_1r = data_1r,
    metadata = list(external=data.frame(NMRExperiment = "10"))
)
bl_threshold <- nmr_baseline_threshold(dataset_1D, range_without_peaks = c(9.5,10))
nmr_baseline_threshold_plot(dataset_1D, bl_threshold, chemshift_range = c(9.5, 10))