Overlay a peak list to a plot
overlay_peaklist.RdOverlay a peak list to a plot
overlay_peaklist(
  peaklist = NULL,
  ...,
  dt_range = NULL,
  rt_range = NULL,
  pdata = NULL,
  color_by = NULL,
  mapping_roi = c(dt_min_ms = "dt_min_ms", dt_max_ms = "dt_max_ms", rt_min_s =
    "rt_min_s", rt_max_s = "rt_max_s"),
  palette = P40
)
Arguments
- peaklist
A data frame with at least the columns:
dt_min_ms,dt_max_ms,rt_min_s,rt_max_sand optionally additional columns (e.g. the column given tocolor_by)- ...
Ignored.
- dt_range
The minimum and maximum drift times to extract (length 2 vector)
- rt_range
The minimum and maximum retention times to extract (length 2 vector)
- pdata
A phenotype data data frame, with a
SampleIDcolumn. This column will be used to mergepdatawithpeaklist, socolor_bycan specify a phenotype.- color_by
A character with a column name of
peaklistorpdata. Used to color the border of the added rectangles and apices. A string with a color name is also acceptable.- mapping_roi
A 4-elements named character vector with the names of the columns from
peaklistthat will be used as the rectangle coordinates.- palette
A character vector with color names to use drawing the rectangles. Use
NULLto letggplot2set the defaults.
Value
A list with the ggplot layers to overlay, including geom_rect and possibly geom_point and scale_fill_manual.
Details
If peaklist includes dt_apex_ms and rt_apex_s a cross will be plotted on the peak apex.
Examples
dt <- 1:10
rt <- 1:10
int <- matrix(0.0, nrow = length(dt), ncol = length(rt))
int[2, 4:8] <- c(.5, .5, 1, .5, 0.5)
int[3, 4:8] <- c(0.5, 2, 2, 2, 0.5)
int[4, 4:8] <- c(1, 2, 5, 2, 1)
int[5, 4:8] <- c(0.5, 2, 2, 2, 0.5)
int[6, 4:8] <- c(.5, .5, 1, .5, 0.5)
dummy_obj <-GCIMSSample(
drift_time = dt,
retention_time = rt,
data = int
)
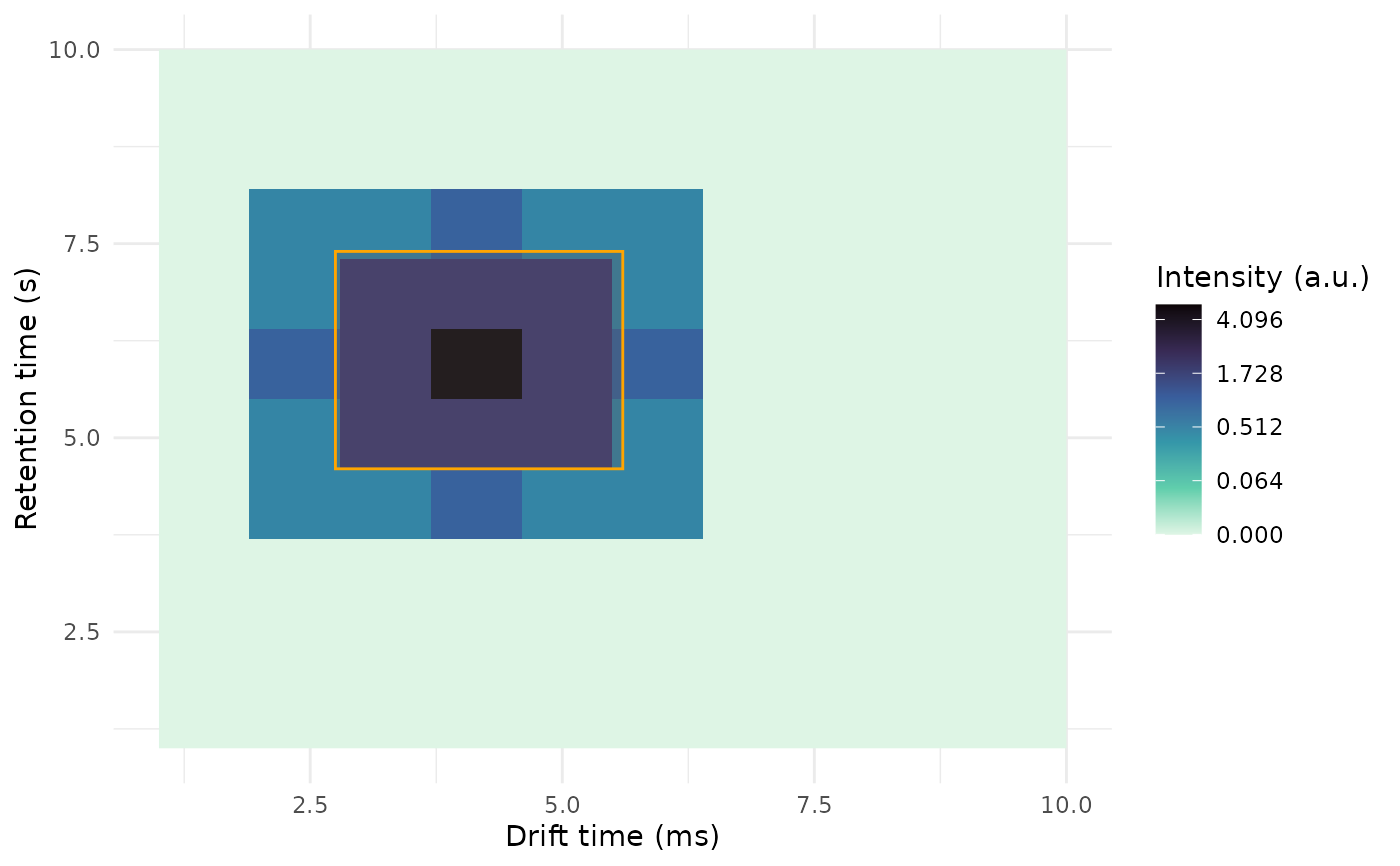
plt <- plot(dummy_obj)
# Add a rectangle on top of the plot
rect <- data.frame(
dt_min_ms = 2.75,
dt_max_ms = 5.6,
rt_min_s = 4.6,
rt_max_s = 7.4
)
plt + overlay_peaklist(
peaklist = rect
)