Topographical plot of a GCIMSSample object
plot-GCIMSSample-ANY-method.RdTopographical plot of a GCIMSSample object
# S4 method for class 'GCIMSSample,ANY'
plot(
  x,
  dt_range = NULL,
  rt_range = NULL,
  ...,
  remove_baseline = FALSE,
  trans = "cubic_root",
  intensity_range = "ranged"
)
Arguments
- x
A GCIMSSample object
- dt_range
A numeric vector of length 2 with the drift time range to plot (in milliseconds)
- rt_range
A numeric vector of length 2 with the retention time range to plot (in seconds)
- ...
Ignored
- remove_baseline
Set to
TRUEto subtract the estimated baseline first- trans
The transformation to the intensity values. "cubic_root" is the default. "intensity" is also valid. See the
transargument inggplot2::continuous_scale()for other possibilities.- intensity_range
Controls the color scale limits. One of:
"ranged"(the default): the range of exactly what's plotted (respectingdt_range,rt_rangeandremove_baseline)."global": this sample's own full, uncropped intensity range, regardless ofdt_range/rt_range– useful to see how strong a cropped region is relative to the whole sample. Withremove_baseline = TRUE, this is the full, uncropped, baseline-removed range.A numeric vector of length 2,
c(min, max): fixed limits. Set this explicitly to make several plots comparable on the same color scale.A length-2 vector/list whose elements are independently a number,
"global"or"ranged", e.g.list(min = 0, max = "global").
Value
A plot of the GCIMSSample
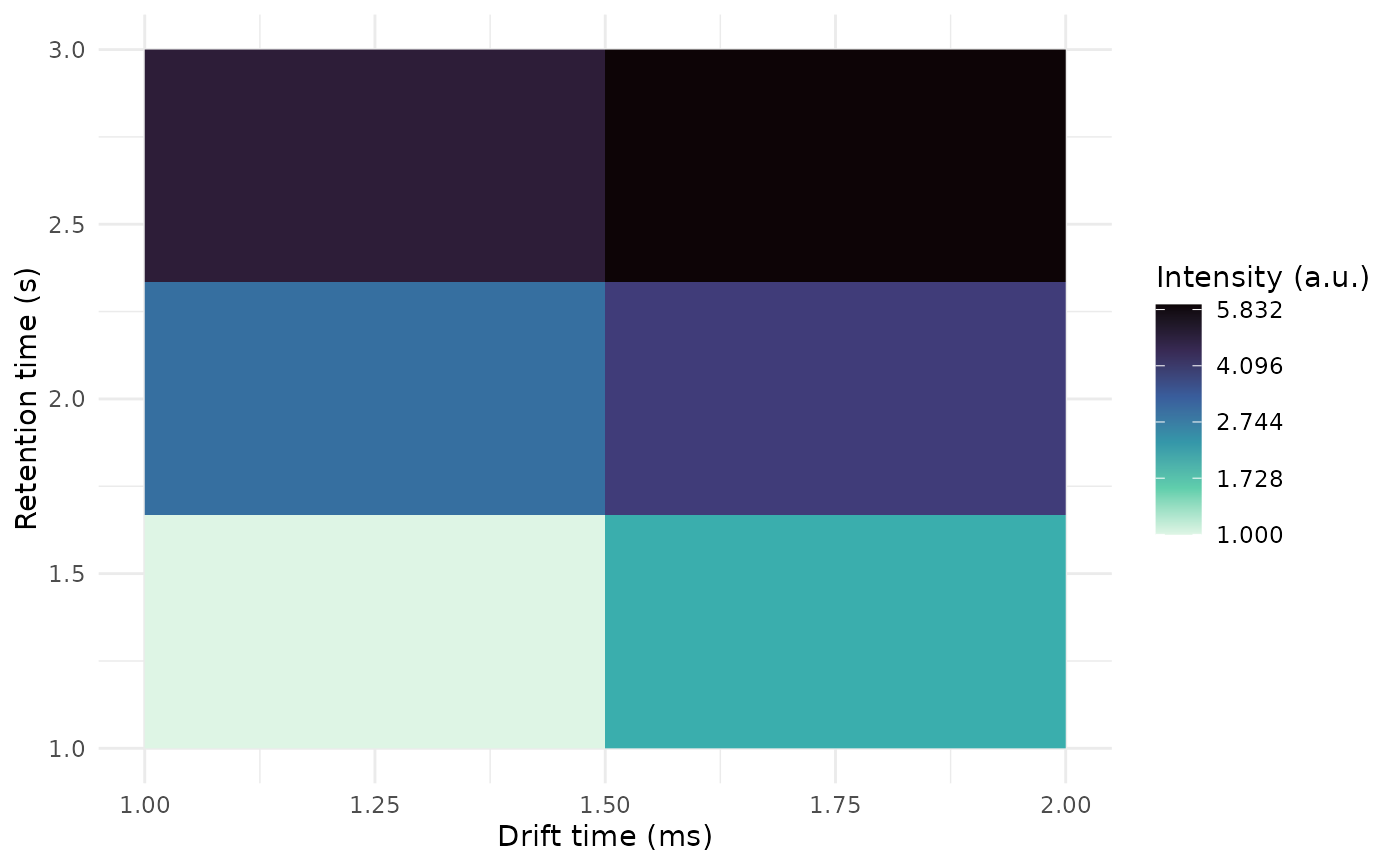
Examples
dummy_obj <-GCIMSSample(
  drift_time = 1:2,
  retention_time = 1:3,
  data = matrix(1:6, nrow = 2, ncol = 3),
  gc_column = "Optional column name",
  drift_gas = "nitrogen",
  drift_tube_length = 98.0 # in mm
)
plot(dummy_obj)